
In the footsteps of 1C_Shell. Investigating attacks using the event log
More in Malware
- This is Siemens...
Recently, our colleagues from the Positive Industrial Expertise Center discovered a curious Windows sample on MalwareBazaar.…
- Anti-antivirus
Recently, we came across an APK with an intriguing and trust-inspiring name: «Антивирус ФСБ.apk». After installing…
- .exe .docm .xlsm
.exe .docm .xlsm Malicious files with these extensions are most often found in corporate network traffic.…
- Operation Chewbacca
At the end of June, the PT ESC team, during incident investigations, discovered a new group…
- Your Zimbra server is at risk
Recently, our PT ESC IR team encountered a new attack by ransomware groups on Zimbra mail…





In one of our previous posts, we wrote about detecting attacks on the 1C system in which threat actors used the 1C_shell tool. It is an external data processor that allows arbitrary code execution on the 1C:Enterprise server.
Such attacks are interesting because they leave few obvious traces in compromised systems. In particular, it is difficult to determine the source of the attack, especially under conditions of Windows event log rotation.
One of the artifacts that can help us in the investigation is the event log.
💡 The event log is a mechanism in the 1C system designed to log user actions, including session start and end.
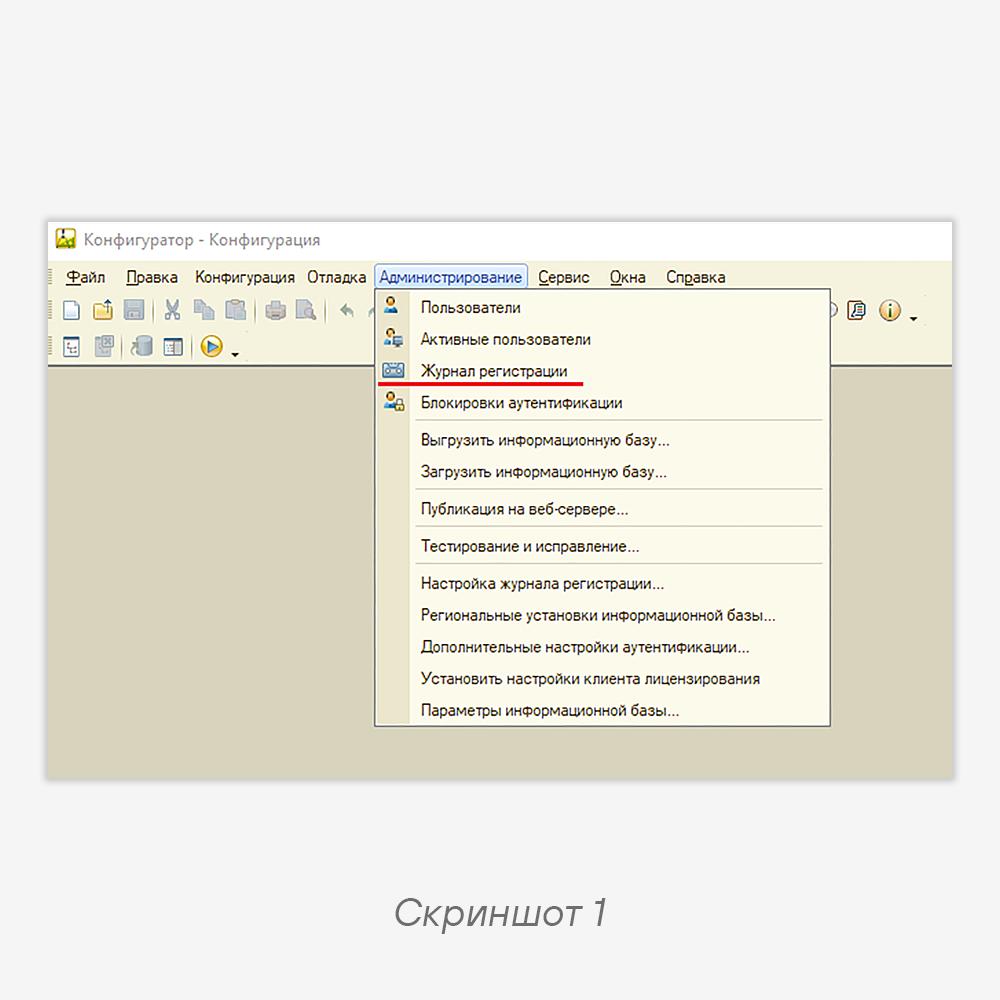
To view the event log, let’s go to the Designer and on the “Administration” tab select the corresponding item (screenshot 1).
In the log, among other things, we can see events for the start and end of user sessions (screenshot 2). Thus, knowing the time interval during which the malicious activity occurred, we can identify suspicious sessions. Within these sessions, the threat actors could have executed commands.
In the case of a client-server infobase, event log files are stored by default in the cluster’s working folder:
C:\Program Files\1cv8\srvinfo\reg_****\****\1Cv8Log
Code language: YAML (yaml)
The logs have an unusual format and are poorly suited for manual analysis. You can read about the format in the Infostart article: the description is relevant for 1C:Enterprise versions 8.1 and 8.2, but the format has changed insignificantly since then.
💡 The current structure of the event log is described in the Administrator Guide for 1C:Enterprise — however, access to the document is restricted.
To parse event log files, you can use the built-in console utility ibcmd, designed for administering the 1C server. It is included in the package supplied with the 1C:Enterprise installation and, starting from version 8.3.25, has functionality for processing event log files.
The utility is located in the folder
C:\Program Files\1cv8\<version>\bin. The folder can be copied and used on another computer without the need to install the 1C system.The utility’s documentation can also be found in the Administrator Guide.
To parse the event log and get a JSONL file as output, you can use the following command:
ibcmd.exe eventlog export -f json --skip-root -o C:\<output_path> \output.jsonl C:\<path_to_1Cv8Log>
Code language: plaintext (plaintext)
Example output line:
{"ApplicationName":"1CV8C","ApplicationPresentation":"Тонкий клиент","Comment":"","Computer":"DESKTOP-QBF9N0A","Connection":"25","Data":null,"DataPresentation":"","Date":"2025-06-02T17:38:31","Event":"_$Session$_.Start","EventPresentation":"Сеанс. Начало","Level":"Information","Metadata":"00000000-0000-0000-0000-000000000000","MetadataPresentation":"<Не определено 00000000-0000-0000-0000-000000000000>","Port":"1560","ServerName":"WIN-UB4CFT0Q9FN","Session":"1","SessionDataSeparation":null,"SessionDataSeparationPresentation":null,"SyncPort":"0","TransactionID":"","TransactionStatus":"NotApplicable","User":"071523a4-516f-4fce-ba4b-0d11ab7a1893","UserName":""}
{"ApplicationName":"1CV8C","ApplicationPresentation":"Тонкий клиент","Comment":"","Computer":"DESKTOP-QBF9N0A","Connection":"0","Data":null,"DataPresentation":"","Date":"2025-06-02T17:38:57","Event":"_$Session$_.Finish","EventPresentation":"Сеанс. Завершение","Level":"Information","Metadata":"00000000-0000-0000-0000-000000000000","MetadataPresentation":"<Не определено 00000000-0000-0000-0000-000000000000>","Port":"0","ServerName":"","Session":"1","SessionDataSeparation":null,"SessionDataSeparationPresentation":null,"SyncPort":"0","TransactionID":"","TransactionStatus":"NotApplicable","User":"071523a4-516f-4fce-ba4b-0d11ab7a1893","UserName":""}
Code language: JSON / JSON with Comments (json)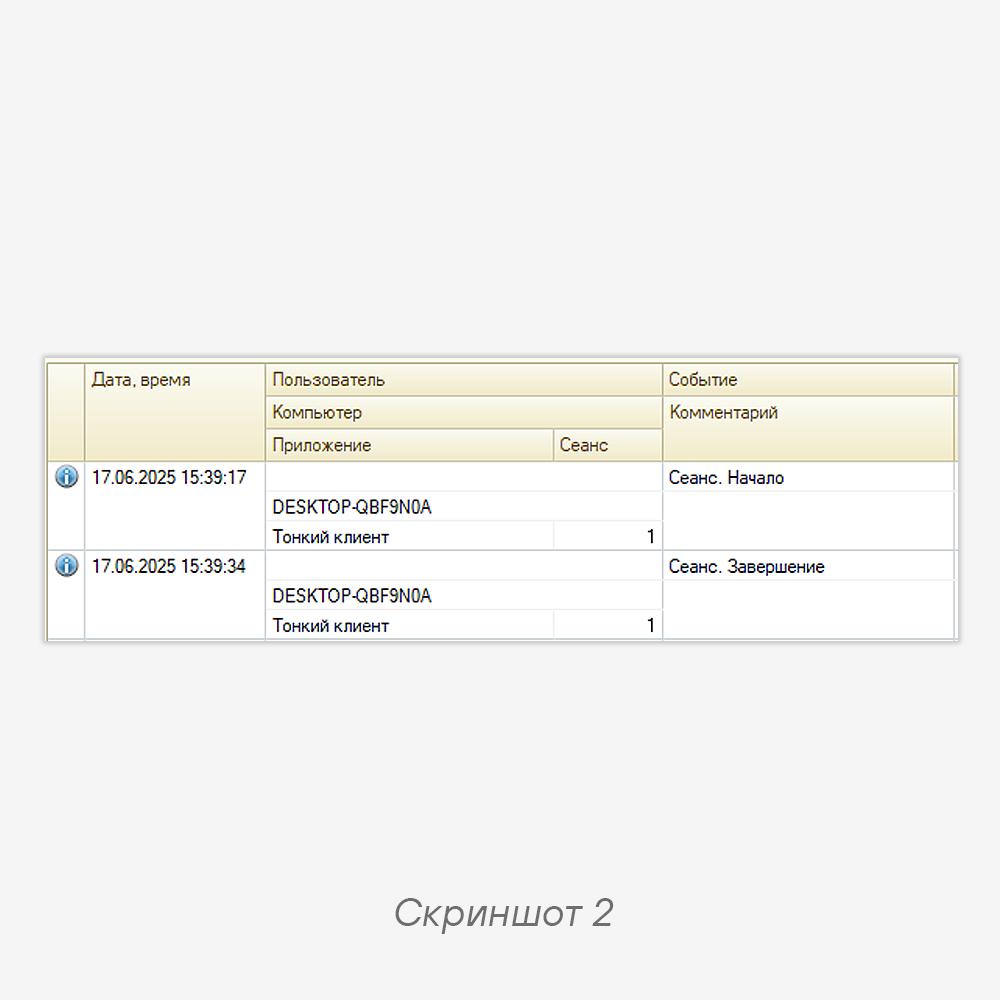
#ir #detect #dfir #malware
@ptescalator
More from oUth0R
- We helped Apple fix a vulnerability in the kernel of its operating systems
We helped Apple fix a vulnerability in the kernel of its operating systems PT ESC expert…
- Recovering EVTX records: carving methods
Recovering EVTX records: carving methods 🧩 When investigating incidents where attackers encrypt virtual machine images, a…
- Operation Chewbacca
At the end of June, the PT ESC team, during incident investigations, discovered a new group…
- Your Zimbra server is at risk
Recently, our PT ESC IR team encountered a new attack by ransomware groups on Zimbra mail…
- He's not your gsocket
He's not gsocket to you 😑 During the investigation of one of the incidents, PT ESC…


More in Malware
- This is Siemens...
Recently, our colleagues from the Positive Industrial Expertise Center discovered a curious Windows sample on MalwareBazaar.…
- Anti-antivirus
Recently, we came across an APK with an intriguing and trust-inspiring name: «Антивирус ФСБ.apk». After installing…
- .exe .docm .xlsm
.exe .docm .xlsm Malicious files with these extensions are most often found in corporate network traffic.…
- Operation Chewbacca
At the end of June, the PT ESC team, during incident investigations, discovered a new group…
- Your Zimbra server is at risk
Recently, our PT ESC IR team encountered a new attack by ransomware groups on Zimbra mail…