
Do you automate debugging?
More in Phishing & sandbox
- ⚡Fake news — THAT'S ALL
⚡Fake news — B U L L S H I T PT ESC specialists discovered an…
- PT ESC cyber intelligence group presented an overview of cyberattacks for Q2 2026 ✍️
PT ESC Cyber Intelligence Group presented an overview of cyberattacks for Q2 2026 ✍️ The report…
- Citizen, update yourself 🫵
Citizen, update yourself 🫵 Recently, a sample mir-pay.apk flew into our sandbox. At first glance, nothing…
- NetMedved: summer campaign against Russian organizations
NetMedved: Summer Campaign Against Russian Organizations 🐻👍 The PT ESC cyber intelligence group has recorded a…
- AI-95 with a malicious additive ⛽️
AI-95 with a malicious additive ⛽️ In mid-June, the Threat Intelligence team discovered several resources at…




The PT Sandbox expert team often has to debug various Windows kernel components in their work, and a kernel debugger is indispensable here. The more often we do this, the greater our desire to optimize this process.
Often during debugging, you want to see changes in variables, arguments, and various runtime values. This can be achieved with conditional breakpoints and commands. Many years ago, WinDbg gained support for a new data model. With the
dx command, you can declare your own variables, structures, call JavaScript functions, and make LINQ queries.For example, we want to log all files opened by the
explorer.exe process:0: kd> dx @$explorer = "explorer.exe"
0: kd> bp /w "@$curprocess.Name.ToLower().StartsWith(@$explorer)" nt!NtCreateFile "dx ((_OBJECT_ATTRIBUTES*)@r8)->ObjectName->Buffer; gc"
Code language: PowerShell (powershell)If the conditions or interception logic are more complex, a script is indispensable. Let’s look at an example.
Suppose we want to catch and save shellcode injected into a remote process. To do this, we need to intercept the
NtWriteVirtualMemory function, check whether the handle belongs to the current process, and if not, save the memory region to disk. Here’s what it looks like in a script:"use strict";
function WriteMemoryCallback()
{
if (host.currentThread.Registers.User.rcx == -1)
{
return;
}
let address = host.currentThread.Registers.User.rdx;
let buffer = host.currentThread.Registers.User.r8;
let length = host.currentThread.Registers.User.r9;
let filename = ${host.currentProcess.Name}-${buffer.toString(16)}.dmp;
let file = host.namespace.Debugger.Utility.FileSystem.TempDirectory.CreateFile(
filename, 'CreateNew');
file.WriteBytes(host.memory.readMemoryValues(buffer, length, 1));
host.diagnostics.debugLog(`dumped ${length} bytes to ${filename}\n`);
file.Close();
}
function initializeScript()
{
return [new host.apiVersionSupport(1, 9)];
}
function invokeScript()
{
let bp = host.namespace.Debugger.Utility.Control.SetBreakpointAtOffset("NtWriteVirtualMemory", 0, "nt");
bp.Command = `dx @$scriptContents.WriteMemoryCallback(); gc`;
}
Code language: JavaScript (javascript)Sometimes the set of APIs provided by the JavaScript engine may not be enough — with
ExecuteCommand you can call any debugger command, for example to delete a breakpoint or set one at a specific address:let exec = host.namespace.Debugger.Utility.Control.ExecuteCommand;
let command = `dx @$scriptContents.BreakPointCallback(); gc`;
exec("bc *");
exec(`bp 0xfffffc024d546a88 "${command}"`);
Code language: JavaScript (javascript)JavaScript also allows you to extend the debugger’s data model, for example by adding info about the sections of loaded DLLs or an additional command similar to
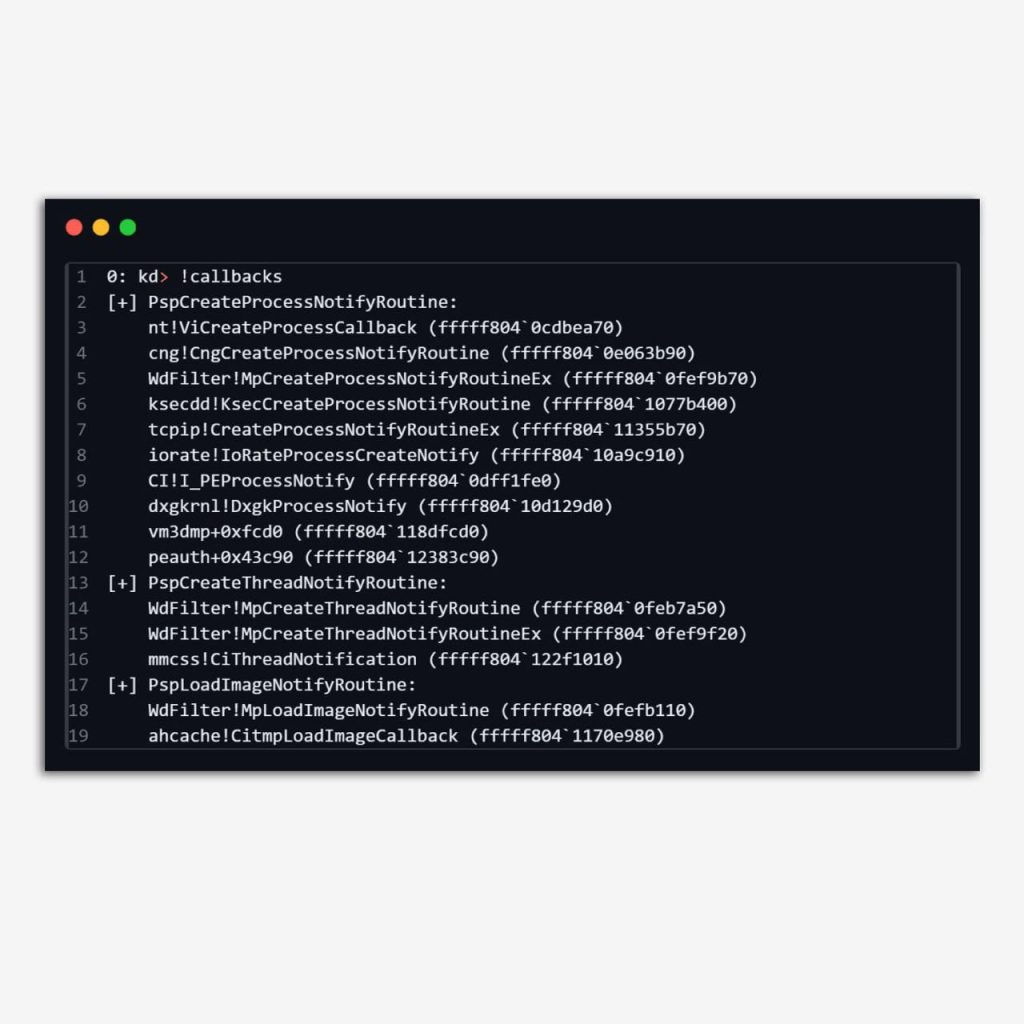
!handle, !address, etc.Suppose we want to enumerate the callbacks for process creation, thread creation, and DLL loading. To do this, we need to create a command, for example
!callbacks:const log = x => host.diagnostics.debugLog(x + '\n');
const u64 = x => host.memory.readMemoryValues(x, 1, 8)[0];
const exec = x => host.namespace.Debugger.Utility.Control.ExecuteCommand(x);
function ParseCallbacks(Symbol, Size)
{
log([+] ${Symbol}:);
let base = host.getModuleSymbolAddress("nt", Symbol);
if (base == null)
return;
for (let i = 0; i < Size; i++)
{
let entry = u64(base.add(i * 8));
if (entry.compareTo(0) != 0)
{
entry = entry.bitwiseAnd(-16);
let callback = u64(entry.add(8));
log(\t${exec(.printf "%y", ${callback}).First()});
}
}
}
function CallbackEnumerator()
{
ParseCallbacks("PspCreateProcessNotifyRoutine", 64);
ParseCallbacks("PspCreateThreadNotifyRoutine", 64);
ParseCallbacks("PspLoadImageNotifyRoutine", 8);
}
function initializeScript()
{
return [new host.apiVersionSupport(1, 7),
new host.functionAlias(CallbackEnumerator, "callbacks")];
}
Code language: JavaScript (javascript)The result is in the screenshot. Modern WinDbg allows you to heavily automate the reverse engineering process, and an experienced analyst surely has a set of frequently used scripts.
#avlab #sandboxteam #tips
@ptescalator
More from global_author
- This is Siemens...
Recently, our colleagues from the Positive Industrial Expertise Center discovered a curious Windows sample on MalwareBazaar.…
- Anti-antivirus
Recently, we came across an APK with an intriguing and trust-inspiring name: «Антивирус ФСБ.apk». After installing…
- .exe .docm .xlsm
.exe .docm .xlsm Malicious files with these extensions are most often found in corporate network traffic.…
- Chaos, shock, private keys from a not-so-private GitLab 💻
Over the past couple of months, the attacker has been distributing trojans from several npm accounts:…
- ::%16777216 — so what exactly are you?
::%16777216 — so what exactly are you? It is known that during attacks, adversaries can use…




More in Phishing & sandbox
- ⚡Fake news — THAT'S ALL
⚡Fake news — B U L L S H I T PT ESC specialists discovered an…
- PT ESC cyber intelligence group presented an overview of cyberattacks for Q2 2026 ✍️
PT ESC Cyber Intelligence Group presented an overview of cyberattacks for Q2 2026 ✍️ The report…
- Citizen, update yourself 🫵
Citizen, update yourself 🫵 Recently, a sample mir-pay.apk flew into our sandbox. At first glance, nothing…
- NetMedved: summer campaign against Russian organizations
NetMedved: Summer Campaign Against Russian Organizations 🐻👍 The PT ESC cyber intelligence group has recorded a…
- AI-95 with a malicious additive ⛽️
AI-95 with a malicious additive ⛽️ In mid-June, the Threat Intelligence team discovered several resources at…